Microsoft Workloads on AWS
Monitor applications and AWS infrastructure using Amazon CloudWatch Application Insights
Amazon CloudWatch Application Insights helps you monitor your applications and AWS infrastructure running those applications by providing easy monitoring setup and a holistic view into the health of your applications. You begin with CloudWatch Application Insights discovering the applications in your AWS Resource Groups or account. Then, it will identify and set up metrics, logs, and alarms most suitable for your application and its infrastructure. Once set up, data points from logs and metrics are continuously monitored. Via this monitoring, CloudWatch Application Insights oversees the health and wellbeing of your AWS applications, generating a notification when an error or anomalous behavior is detected. In addition, it can correlate errors from different parts of the application and present an insight in the form of an automated dashboard, allowing you to dive deep into problems to uncover their root cause.
For example, imagine an ASP.NET application running on instances load balanced using Elastic Load Balancing (ELB) and connected to Microsoft SQL Server. This application is experiencing an intermittent error: users are complaining that a few parts of the application are throwing errors while the rest of the application is working fine. The customer configures CloudWatch Application Insights to monitor this application. CloudWatch Application Insights detects a high rate of HTTP 500 errors experienced by ELB, and highlights it as a detected problem (please see Figure 1).
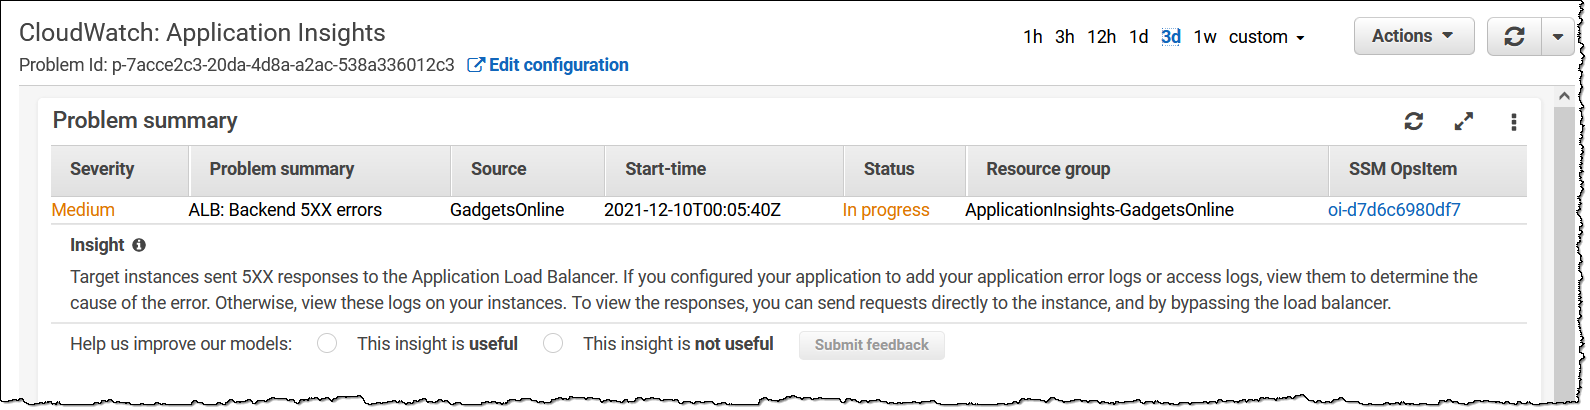
Figure 1 : CloudWatch Application Insights problem summary
CloudWatch Application Insights correlates ELB metrics and errors captured in SQL Server error logs and presents them side-by-side in an automated dashboard, as shown in Figure 2. This automatic detection helps troubleshoot the root cause and reduces the mean time to resolution (MTTR).

Figure 2 : CloudWatch Application Insights automated dashboard
The SQL Server error 1105 highlighted by CloudWatch Applications Insights is a “No disk space is available in a filegroup” error. This explains why parts of the application that required DB write or update operations failed, while read-only operations did not fail. A typical troubleshooting process in the absence of CloudWatch Application Insights would involve investigating the issue and log analysis at the load balancer, Web server, and SQL Server levels. But with CloudWatch Application Insights, it’s all brought together so you can quickly and easily remediate the problem.
Setting up CloudWatch Application Insights
- Navigate to Amazon CloudWatch service on the AWS console and then select Application Insights link in the left navigation bar in AWS Management Console to onboard your application to CloudWatch Application Insights.
- By default, you will see no assets are monitored (see Figure 3). Select Add an application to start application onboarding.

Figure 3 : CloudWatch Application Insights monitored assets
- As you can see in Figure 4, there are two ways to onboard your applications. First is Resource group based application onboarding, which requires creating a resource group consisting of all the application components that CloudWatch Application Insights should monitor. The second method is Account based application onboarding, which is suitable to monitor all the resources in an account without having to create resource groups.
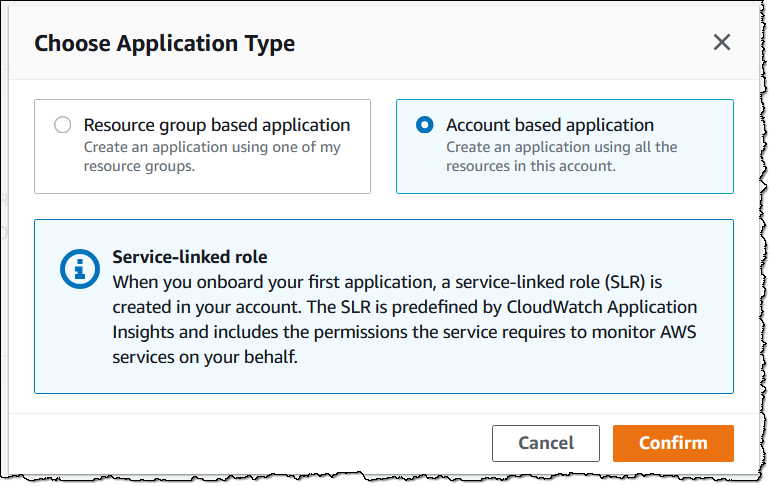
Figure 4 : CloudWatch Application Insights application type
- After clicking the Confirm button, you can check Automatic monitoring of new resource box on the next screen to automatically allow onboarding of new components in the future. Select Monitor CloudWatch Events to get insights from services that support CloudWatch events.

Figure 5 : Add an application
- In Figure 6, you will see a list of resources in your account discovered by CloudWatch Application Insights.
Application components supported by CloudWatch Application Insights include Amazon EC2, Amazon Elastic Block Store (Amazon EBS), Amazon Relational Database Service (Amazon RDS), ELB in both Application and Classic Load Balancer configurations, AWS Lambda, Amazon Simple Storage Service (Amazon S3), and many other services, which generate various logs and metrics. These logs and metrics include CloudWatch metrics for AWS services, as well as OS-level and application-level logs.
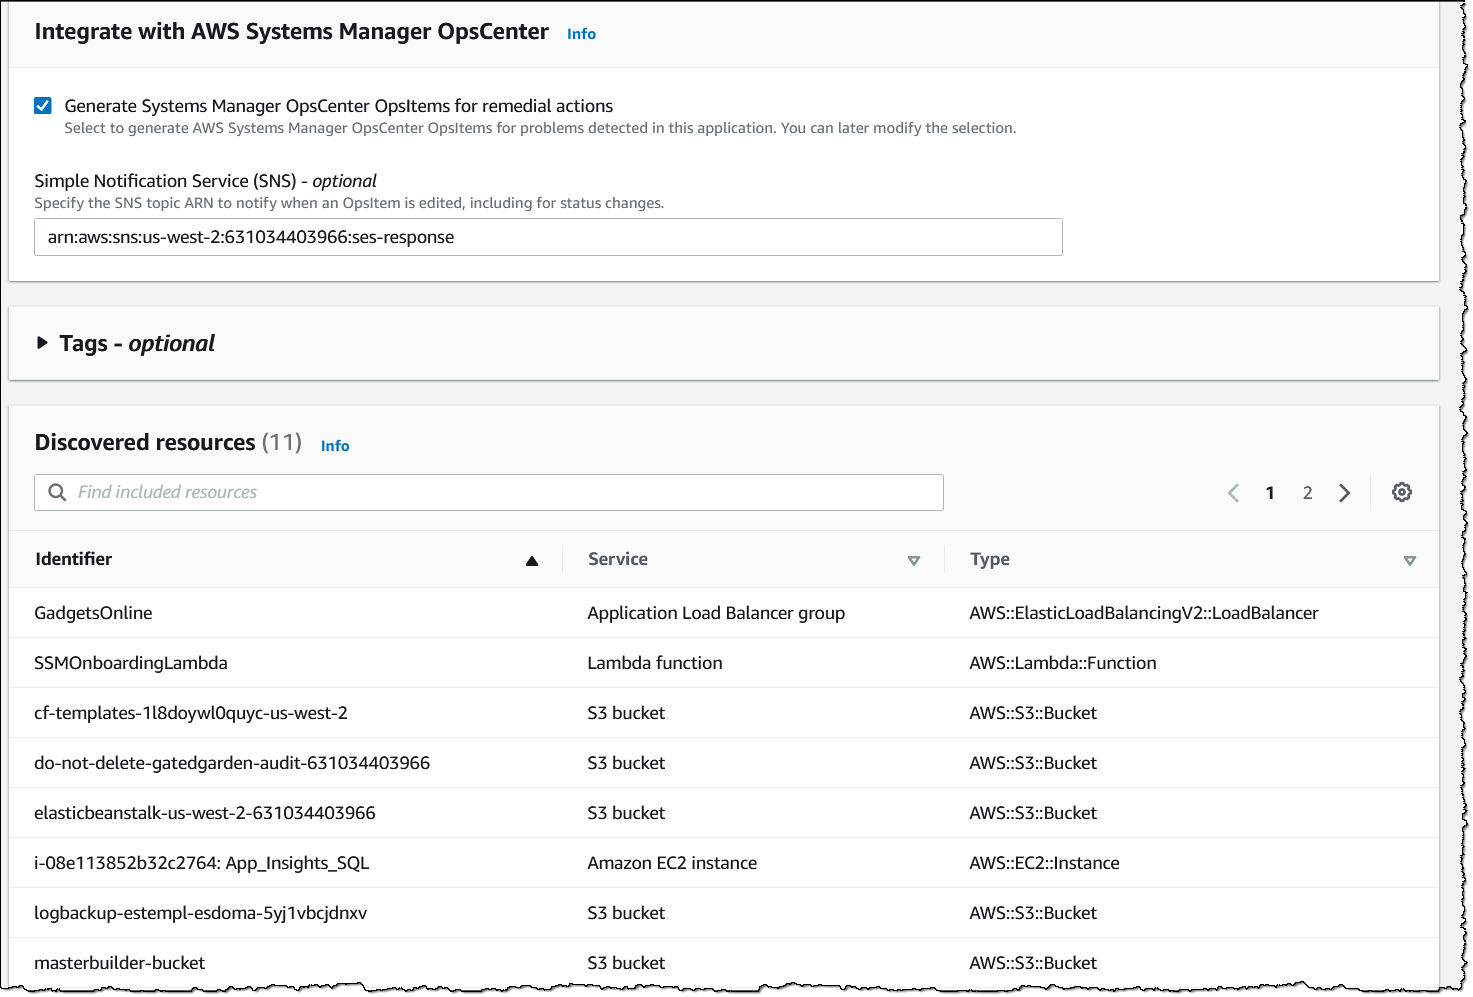
Figure 6 : Discovered resources
You can optionally select Generate Systems Manager OpsCenter OpsItems for remedial actions to integrate CloudWatch Application Insights with AWS Systems Manager OpsCenter. OpsCenter is a capability of AWS Systems Manager that provides a central location where operations engineers and IT professionals can view, investigate, and resolve operational work items (called OpsItems) and associate runbooks related to AWS resources.
- After clicking Next, an Application Insights Application is generated and you can see the Application Summary and Monitored Components.
An application is a group of components being monitored; for example, an application can have a database, web app, and a message queue as three different components. A component is an auto-grouped, standalone, or custom grouping of similar resources that make up an application. For example, a web app can be a group of an Application Load Balancer and EC2 instances running the web application.
Telemetry is the total number of metrics, logs, and alarms configured for monitoring by CloudWatch Application Insights.
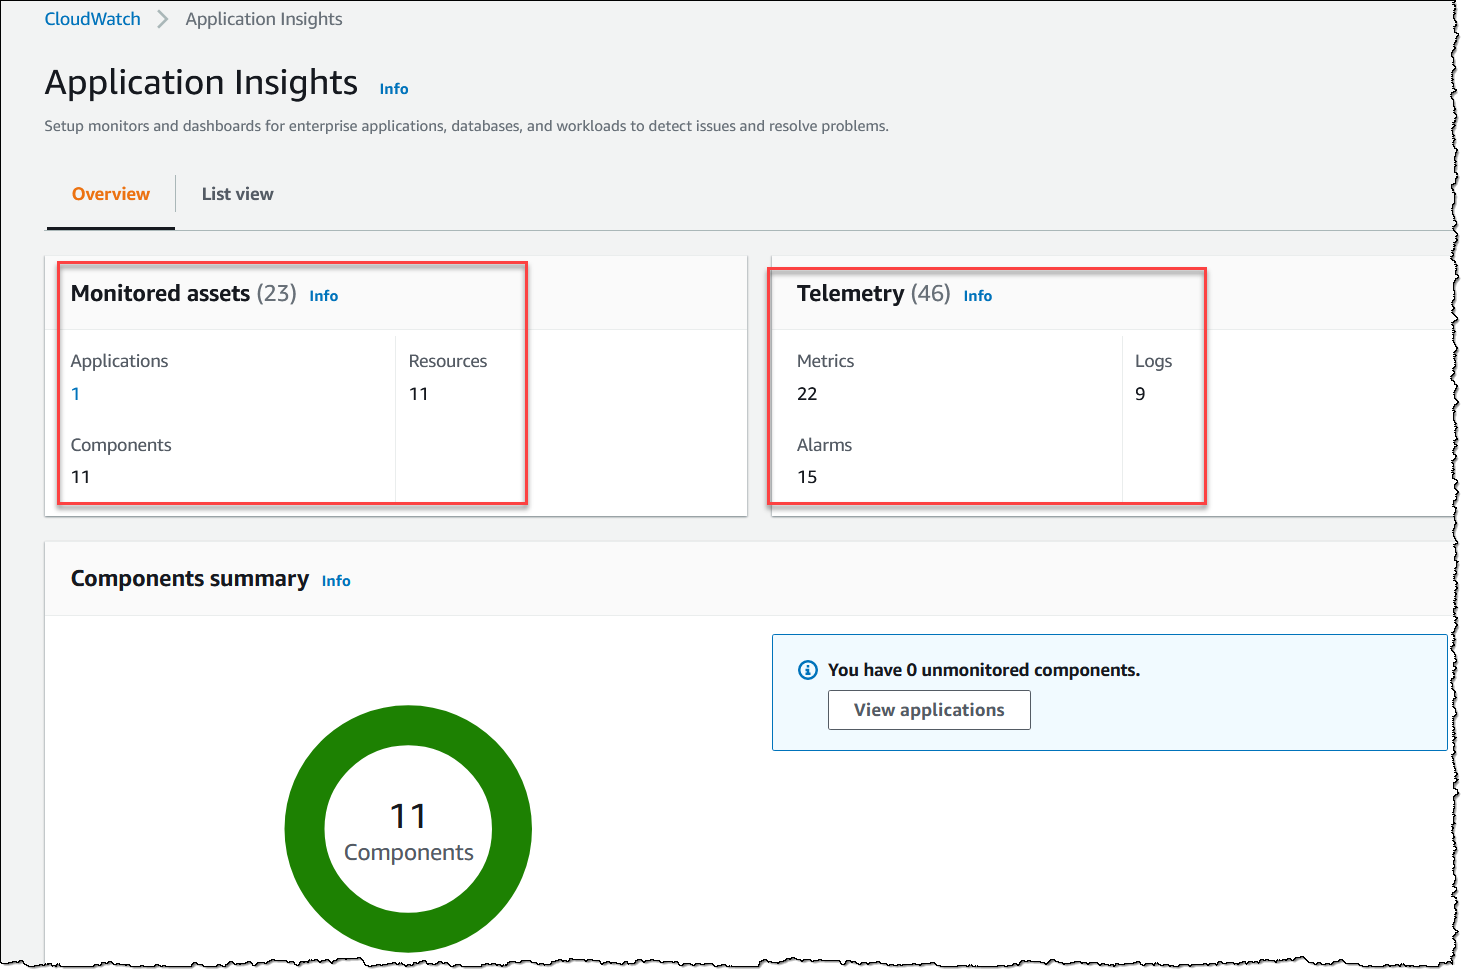
Figure 7 : CloudWatch Application Insights overview
You can remove components from the monitoring, or change the monitoring of components after the fact as well.
Integration with Amazon CloudWatch Container Insights
Amazon CloudWatch Container Insights helps monitor your containerized applications by collecting, aggregating, and summarizing metrics and logs. It’s available for Amazon Elastic Container Service (Amazon ECS), Amazon Kubernetes Service (Amazon EKS), and Kubernetes platforms on Amazon EC2. CloudWatch Application Insights integrates seamlessly with CloudWatch Container Insights . If you currently use CloudWatch Container Insights to monitor your containerized applications, you have the option to enable and visualize CloudWatch Application Insights data within the CloudWatch Container Insights console.
An Amazon ECS cluster created after account-based onboarding will be automatically integrated with CloudWatch Application Insights if CloudWatch Container Insights are enabled for the cluster. You can set up CloudWatch Container Insights on both new and existing Amazon ECS clusters. Once you enabled the integration, you can see problems detected by CloudWatch Application Insights inside the CloudWatch Container Insights dashboard on the console. In Figure 8, Application Insights lists detected problems in the Container Insights console as soon as an anomaly is detected.
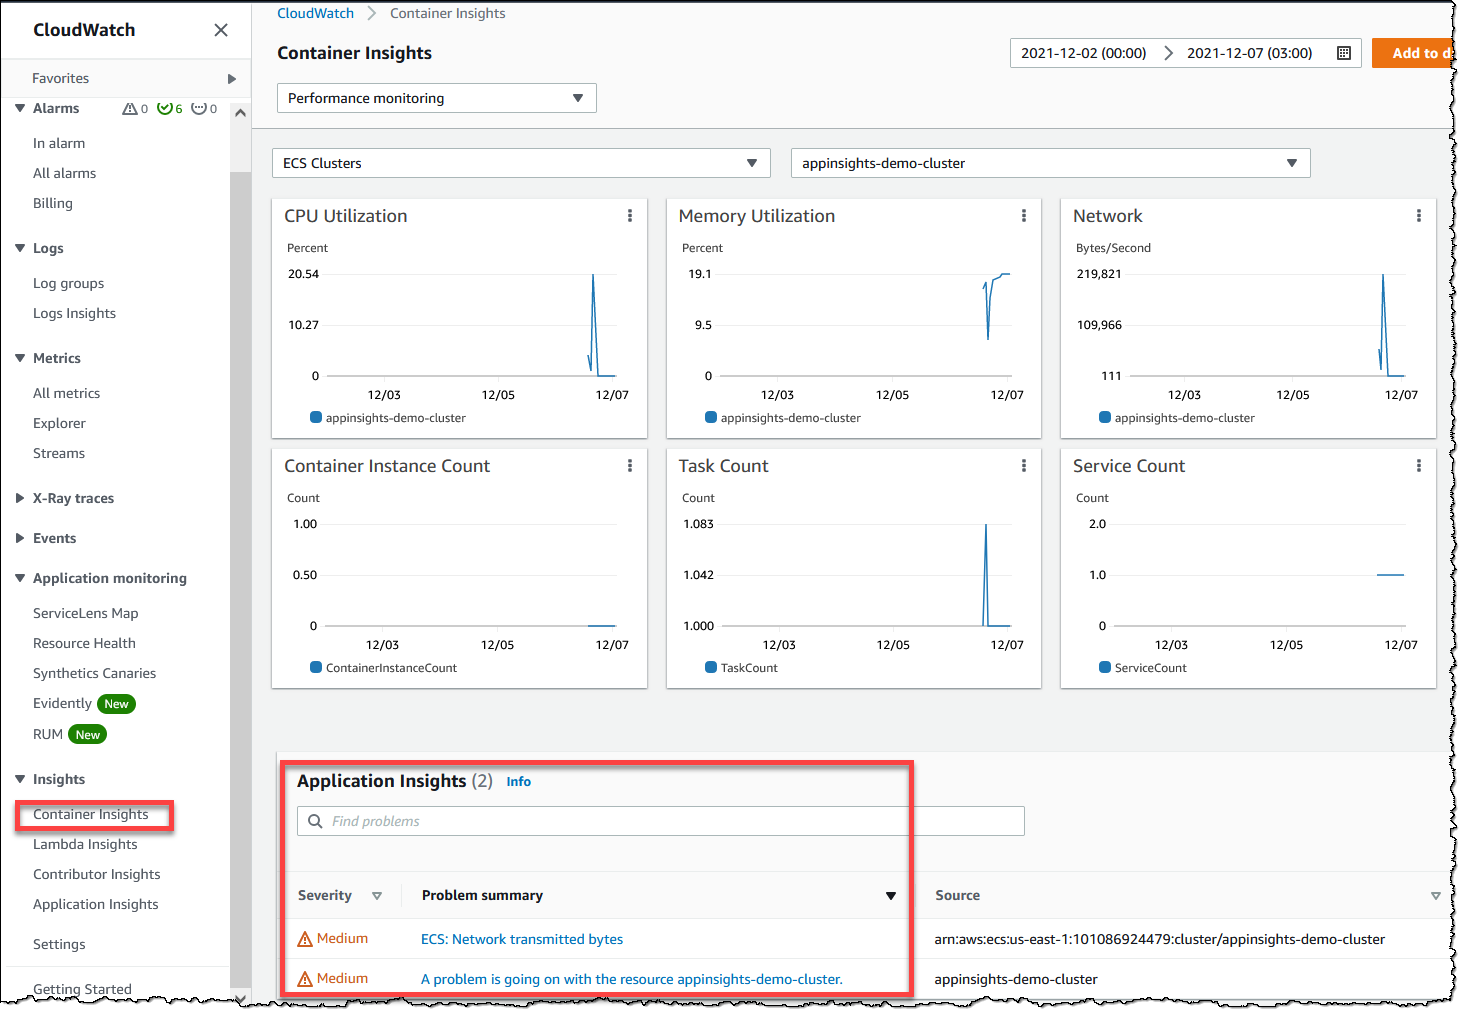
Figure 8 : CloudWatch Container Insights
Selecting Problem Summary shows details about the detected problem in a CloudWatch Application Insights automated dashboard (see Figure 9).
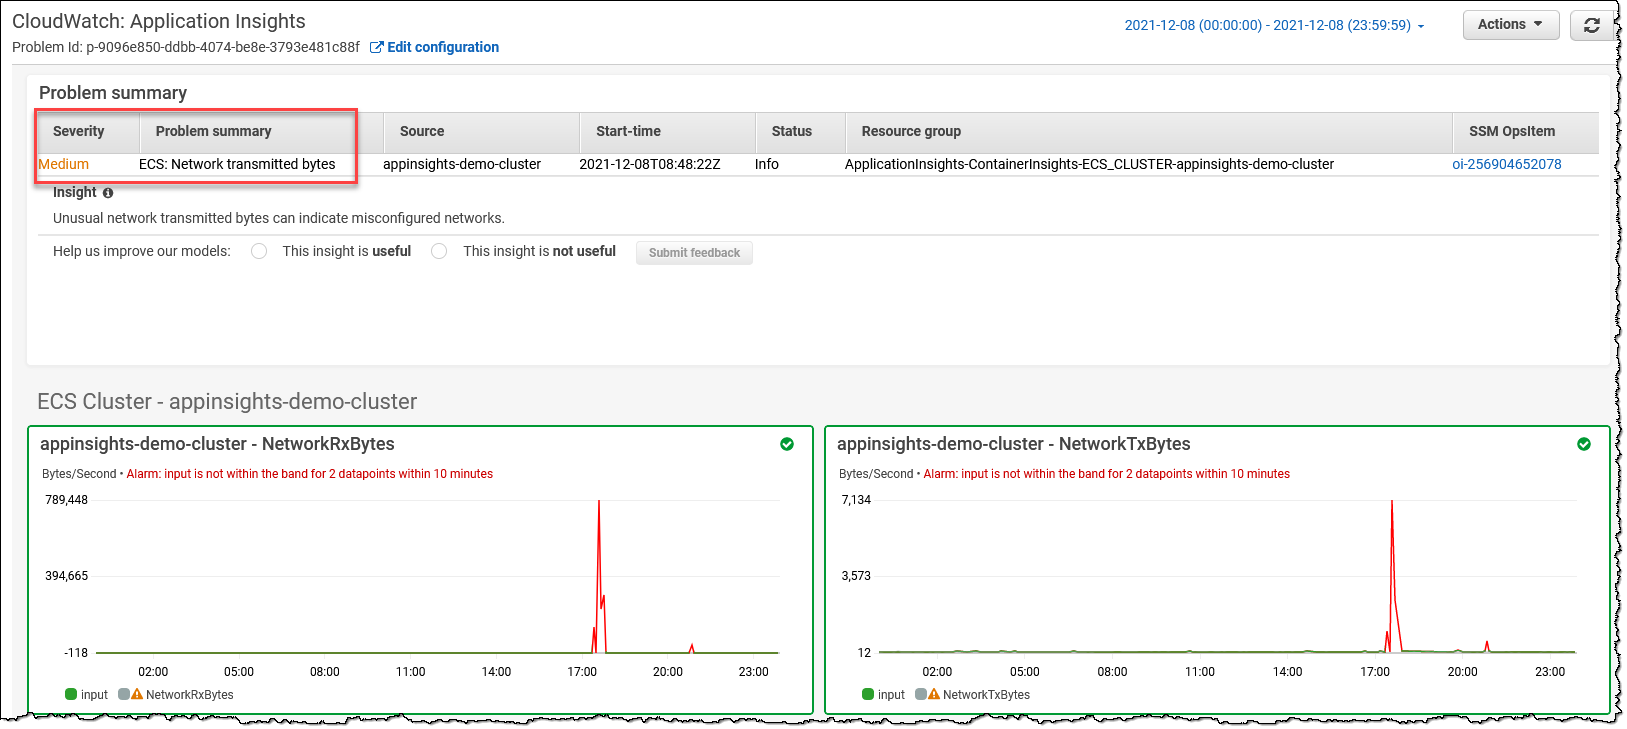
Figure 9 : Problem Summary
Integration with AWS Launch Wizard
CloudWatch Application Insights also integrates with AWS Launch Wizard to provide a one-click monitoring setup experience for deploying workloads based on highly available SQL Server architectures. When you select the option to set up monitoring and insights with CloudWatch Application Insights on the Launch Wizard console (see Figure 10), CloudWatch Application Insights automatically sets up relevant metrics, logs, and alarms on CloudWatch, and starts monitoring newly deployed workloads.
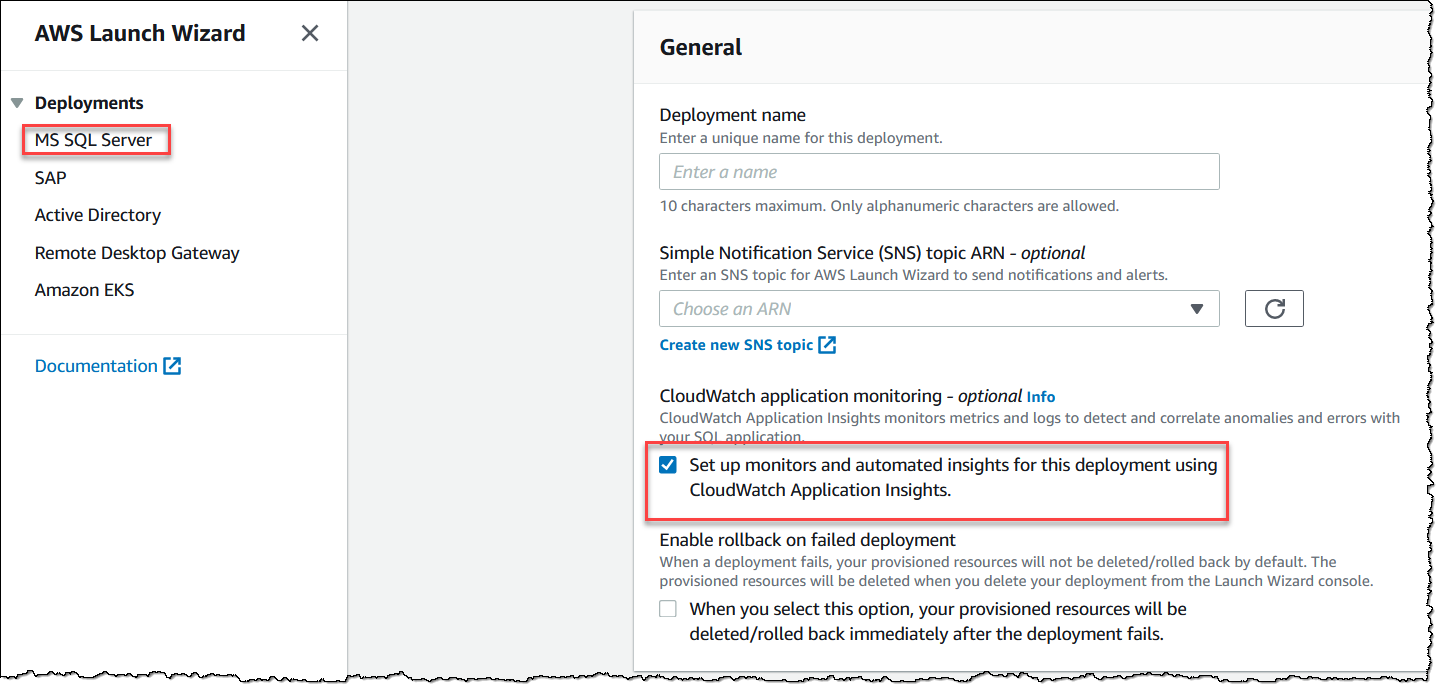
Figure 10 : Launch Wizard Integration
On the CloudWatch Application Insights console, you can view monitored components and automated insights and detected problems, along with the health of your SQL Server workloads.
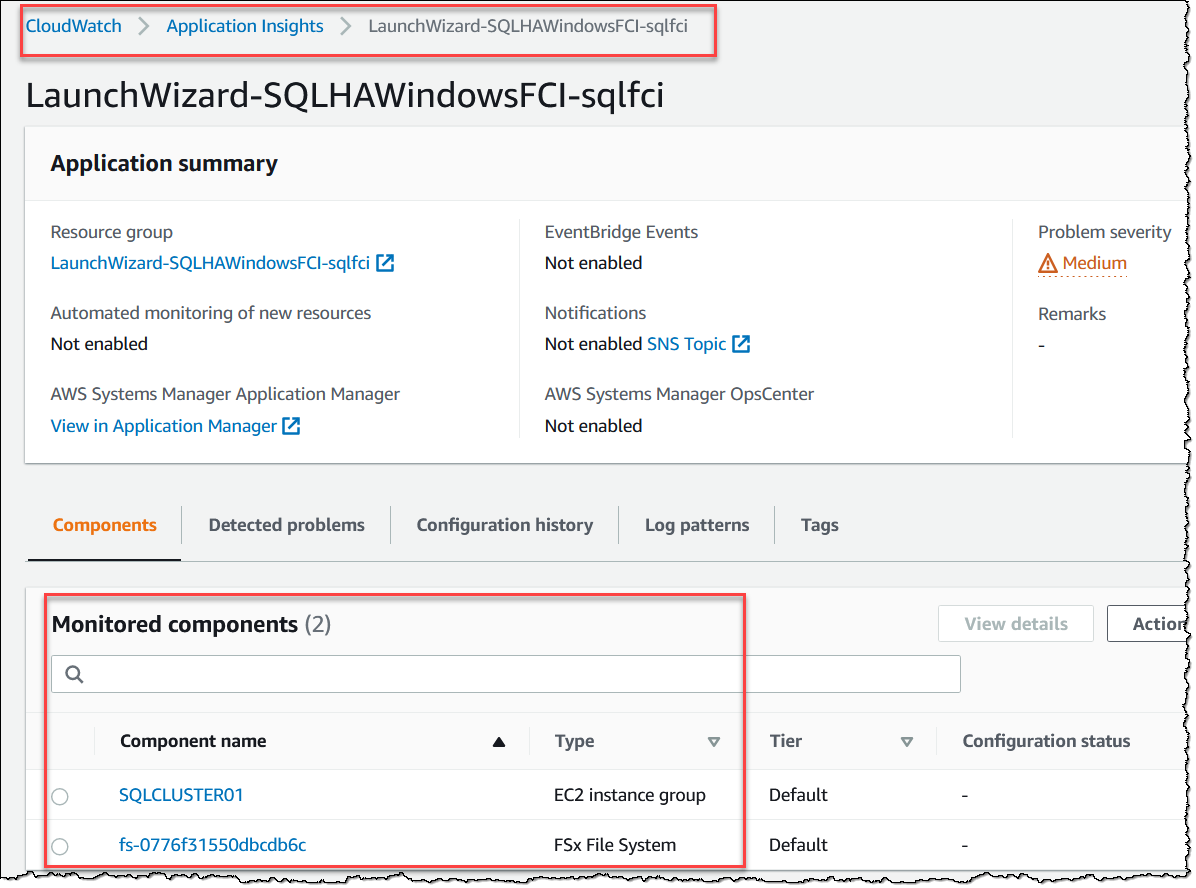
Figure 11 : Application summary for the application launched through Launch Wizard
Summary
With easier account-level onboarding and integration with other AWS Services, such as CloudWatch Container Insights and AWS Launch Wizard, CloudWatch Application Insights enables observability for your applications and underlying AWS resources with just a few clicks. For detected issues, you can use CloudWatch Automatic Dashboards to visualize problem details. This helps application owners troubleshoot faster and reduce their mean time to resolution. Please refer to the CloudWatch pricing to learn more about charges associate with using CloudWatch. Note that you will not be charged for setup assistance, monitoring data analysis, or problem detection that CloudWatch Application Insights is providing using data collected by CloudWatch. CloudWatch Application Insights is available in all AWS public regions.
Follow the blog channel Windows on AWS for easy to consume, focused blog posts, and case studies about Windows and .NET workloads on AWS. You can also follow the .NET on AWS YouTube playlist, and the official .NET on AWS Twitter handle to get the latest news about .NET on AWS.
AWS can help you assess how your company can get the most out of cloud. Join the millions of AWS customers that trust us to migrate and modernize their most important applications in the cloud. To learn more on modernizing Windows Server or SQL Server, visit Windows on AWS. Contact us to start your modernization journey today.