AWS Cloud Operations & Migrations Blog
Analyzing AWS WAF Logs in Amazon CloudWatch Logs
Update April 17 2023 : The Contributor Insights rules provided in this blog post are now natively available in CloudWatch Contributor Insights.
This post shows you how to use Amazon CloudWatch features, such as Logs Insights, Contributor Insights, and Metric Filters to analyze AWS Web Application Firewall (AWS WAF) logs, create dashboards, and generate alarms. CloudWatch Logs Insights provides you with a way to identify security incidences and false positives by interactively searching and analyzing your WAF log in Amazon CloudWatch Logs. By default, the WAF console provides a few sample queries to analyze your WAF logs using Logs Insights. You can extend this by writing your own queries. Contributor Insights provide a cost-efficient way to create dashboards for top N-contributors providing an easy platform to perform ongoing analysis for your WAF by easily surfacing outliers, top IP address, URIs, terminating rule Ids, User-agent, and more. Metric filters let you define terms and find specific patterns in WAF logs. This can be used to match terms in your log events, convert log data into metrics, and generate alarms.
Previously, WAF logs had to be sent via Amazon Kinesis Data Firehose to AWS OpenSearch, third-party solutions for dashboards, or to Amazon Simple Storage Service (Amazon S3) paired with Amazon Athena for log analysis. Customers would have a high volume of incoming logs, where analyzing logs would become difficult as these configurations required the integration of multiple services for log analysis and dashboards. This was also expensive and customers needed separate teams to keep the solution up to date. To simplify this, logs can now be sent directly to CloudWatch for log analysis, dashboard creation, and viewing alarms in a single pane using CloudWatch features, such as metric filters, Logs Insights, Anomaly detection, and Contributor Insights.
Setup
To configure WAF logs to be sent to CloudWatch Logs, use the following steps.
- In the AWS CloudWatch Console, go to Log groups.
- Select Create log group.
- Give the Log group a descriptive name. The Log group name should start with aws-waf-logs- (e.g., aws-waf-logs-test as shown in the screenshot above). Choose the Retention settings to suit your requirements, and select Create.
- Navigate to the AWS WAF console, and select the WebACL that you want to enable logging, then go to Logging and metrics → Edit.
- In the Edit logging page, select CloudWatch Logs log group as the Logging destination, and select the log group that we created in Step 3.
- If you want to redact any fields or filter web requests, then select the settings as necessary and Save.
- You should now see that the CloudWatch Logs Insights console is enabled within the CloudWatch Log Insights tab.
- Alternatively, you can use the following AWS CloudFormation template to enable logging with CloudWatch log group as the destination.
![Screenshot displaying the Create log groups prompt in the CloudWatch Console, populated fields include the log group name, as “aws-waf-logs-test”. All of the other fields are left as their default values.]](https://d2908q01vomqb2.cloudfront.net/972a67c48192728a34979d9a35164c1295401b71/2022/08/09/us-east-1.console.aws_.amazon.com_cloudwatch_home_regionus-east-1-2-1-1024x483.png)
Figure 1: Creating a log group in CloudWatch console
You can use the CloudFormation template here to enable logging for your WebACL. If you have a GLOBAL WebACL (for CloudFront distribution), then deploy the template in us-east-1.
After configuring CloudWatch as the WAF logging destination, you can use CloudWatch Logs Insights to interactively search and analyze the incoming logs by following these steps:
- Within the WAF console, select Web ACLs and change the region to the one containing your WAF resource.
- Select the Web ACL name for which you enabled logging.
- Select the CloudWatch Logs Insights tab.
![Screenshot displaying the logging settings in the WAF console. The screenshot shows the CloudWatch Logs group radial option selected, with the “aws-waf-logs-test” log group selected from the Log Group dropdown menu. All other options are left at their default value.]](https://d2908q01vomqb2.cloudfront.net/972a67c48192728a34979d9a35164c1295401b71/2022/08/02/us-east-1.console.aws_.amazon.com_wafv2_homev2_web-acl_test123_d5898245-a8bd-4e59-b202-5470970b456f_editloggingconfiguration_regionus-east-1-2.png)
Figure 2: Enabling WAF logging to a CloudWatch log group
In the query editor you can run the default query as follows. This will display the last 20 log entries received along with associated timestamps.
fields @timestamp, @message
| sort @timestamp desc
| limit 20
Additionally, you can select “Most frequently used queries” from the query list, including the Top 100 including Top 100 IP addresses, Top 100 countries, Top 100 user-agents, Top 100 hosts, and Top 100 terminating rules.
Log Insights
Example 1: Using default queries from the WAF console to get the top 100 IP addresses
This example will execute the following query, which extracts the clientIp from the httpRequest, count the number of requests from each clientIp, order the clientIPs by descending order by the request count, and display the top 100 IP addresses that make the most requests to your application.
fields httpRequest.clientIp
| stats count(*) as requestCount by httpRequest.clientIp
| sort requestCount desc
| limit 100
After you select the query and “Run query”, you’ll see the list of IP addresses and its count in the Logs tab. If you go to the Visualization tab, then you can select from Line, Bar, and Pie to display the results.
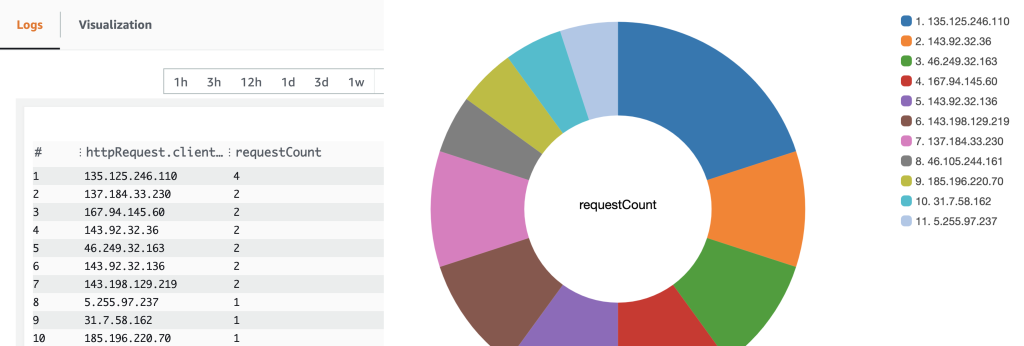
Figure 3: Query result in WAF console for top 100 IP Addresses
The WAF console provides similar queries for the top 100 counties, user agents, hosts, and terminating Rules. These top 100 lists can be very useful in customizing your WebACL to protect your application against potentially unwanted traffic, such as spam. You must set a specific period when running the query and the queries will timeout after 15 minutes. In addition, you can set the results to refresh on an interval if you must look at near real-time.
In addition to the sample queries given in the WAF console, you can write customized queries to analyze your logs. This is explained in more detail in the next section.
Example 2: Find patterns that triggered Cross-Site Scripting (XSS) or SQL Injection in either terminatingRule for a custom rule or AWS Managed Rule Group
Here’s a query to find patterns that triggered Cross-Site Scripting (XSS) or SQL Injection in either terminatingRule for a custom rule or AWS Managed Rule Group. This returns entries with a timestamp, the client IP address, the origin country, the details of the match, and the request ID.
fields @timestamp
| parse @message ',"terminatingRuleMatchDetails":[*],' as terminatingRuleMatchData
| filter (terminatingRuleMatchData like /XSS/ or terminatingRuleMatchData like /SQL/)| display @timestamp, httpRequest.clientIp, httpRequest.country, terminatingRuleMatchData, httpRequest.requestId
limit 100
Example 3: Obtain the top ten User-Agents for all of the requests counted by a rule
This query will look for the User-Agent key-value pairs and filter the requests that were counted. The results will return the top ten User-Agents with the most requests, and then return a count for each user-agent. Keep in mind that the User-Agent key is case sensitive.
fields @timestamp, @message
| parse @message '{"name":"User-Agent","value":"*"}' as userAgent
| parse @message ',"nonTerminatingMatchingRules":[{"ruleId":"*","action":"*"' as rule, action
| filter action = "COUNT"
| stats count(*) as requestCount by userAgent
| sort requestCount desc
| limit 100
Example 4: Entries that are counted by a specific rule in a rule group
This query will look for ten log entries that are counted by a specific rule in a rule group where the request was terminated by the default action. In this case, the specific rule used is NoUserAgent_HEADER in the rule group. You can change the “ruleId” field to the rule ID that you want to analyze. The results display the timestamp, the client IP address, the originating country, and the requestId for further processing.
fields @timestamp
| filter (@message like 'excludedRules":[{"exclusionType":"EXCLUDED_AS_COUNT","ruleId":"NoUserAgent_HEADER"}]}' and @message like 'terminatingRuleId":"Default_Action"')
| parse @message '"ruleId":*}]}' as ruleMatchDetails
| display @timestamp, httpRequest.clientIp, httpRequest.country, ruleMatchDetails, httpRequest.requestId
|limit 10
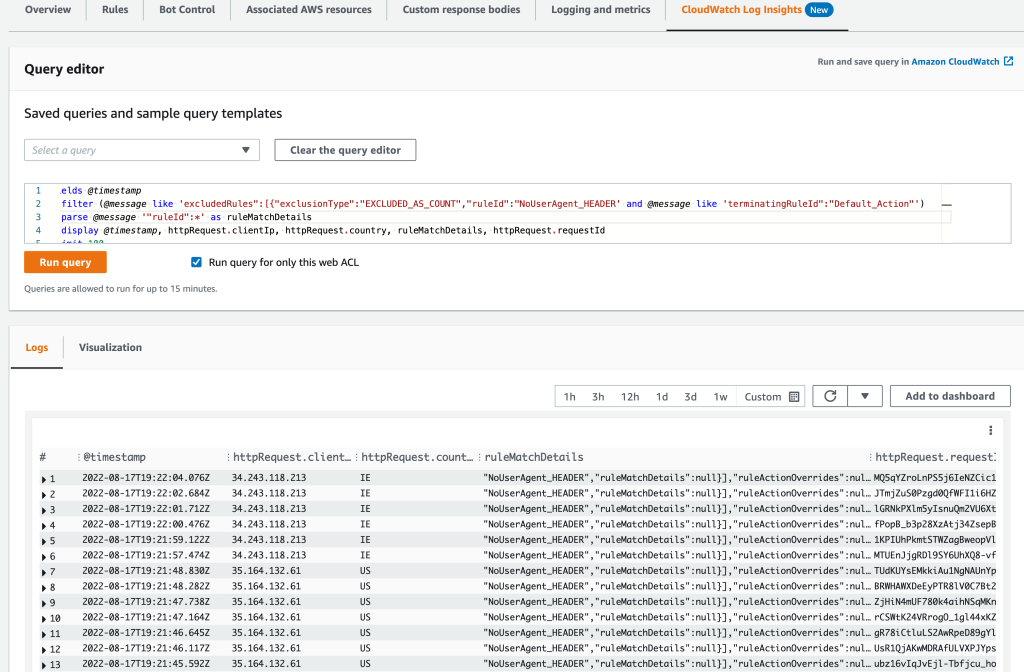
Figure 4: Log Insights results on example 4 showing the matched rule ID and the request ID
Example 5: Top 100 requests with invalid captchas
AWS WAF Captcha can be used to block unwanted bot traffic by requiring users to successfully complete challenges before their web request are allowed to reach AWS WAF protected resources. You can use the following query to look for the top 100 requests with invalid captchas. This returns the time that the request was made, the IP address, request ID for further processing, the response code, and the entire message for a deeper analysis.
fields @timestamp, httpRequest.clientIp, httpRequest.requestId, captchaResponse.failureReason, @message
|filter captchaResponse.failureReason ='TOKEN_MISSING'
| sort @timestamp desc
| limit 100
You can additionally add the queries that you run to dashboards to monitor your traffic patterns and have a more holistic view of your WAF traffic.
Metric filters
In this next section, we discuss how CloudWatch metric filters can be leveraged for additional monitoring and alerting. By using metric filters in CloudWatch Logs, you can search for terms, phrases, or values in your log events. Once you find a term, phrase, or value, you can increment a CloudWatch metric to capture a count over time. You can optionally create CloudWatch alarms to notify you or take action when a threshold is reached.
To create a metric filter using the CloudWatch console, follow the steps in this guide here.
The following are some sample patterns for creating filters for WAF logs. Note that you must replace the variable “[i]” with the correct number value. For example, say you have four Rule Groups in your WebACL, then for ruleGroupList[i], selecting two would look at the third rule group in the WebACL.
Pattern 1: If you want to get all of the requests that are counted by a rule group and not an individual rule, then you can use the following which looks at counts for AWS-AWSManagedRulesCommonRuleSet. You can replace the rule group that you want to monitor.
{($.nonTerminatingMatchingRules[i].ruleId=AWS-AWSManagedRulesCommonRuleSet)}
Pattern 2: This gets all of the requests that are blocked or counted by a certain rule group.
{$.ruleGroupList[i].terminatingRule.action=BLOCK}
Pattern 3: This filter finds all of the requests blocked by a particular rule in the rule group. You can replace the rule ID SignalNonBrowserUserAgent with the rule ID that you’re interested in monitoring.
{($.ruleGroupList[i].terminatingRule.action=BLOCK)&&($.ruleGroupList[i].terminatingRule.ruleId=SignalNonBrowserUserAgent)}
In addition to creating metric filters, you can use filters in CloudWatch Log groups to perform ad hoc filtering on your logs to get the requests that you want to review.
Pattern 4: For example, you can use a filter like this to look for all logs that show blocked requests.
{$.action="BLOCK"}
You can also use a metric filter to get all of the Counted requests for a rule.
{$.nonTerminatingMatchingRules[i].action = "COUNT"}
Pattern 5: You can use this metric filter pattern to look for requests that were counted by a specific rule in a rule group in your WebACL.
{($.ruleGroupList[i].excludedRules[i].exclusionType= "EXCLUDED_AS_COUNT")}
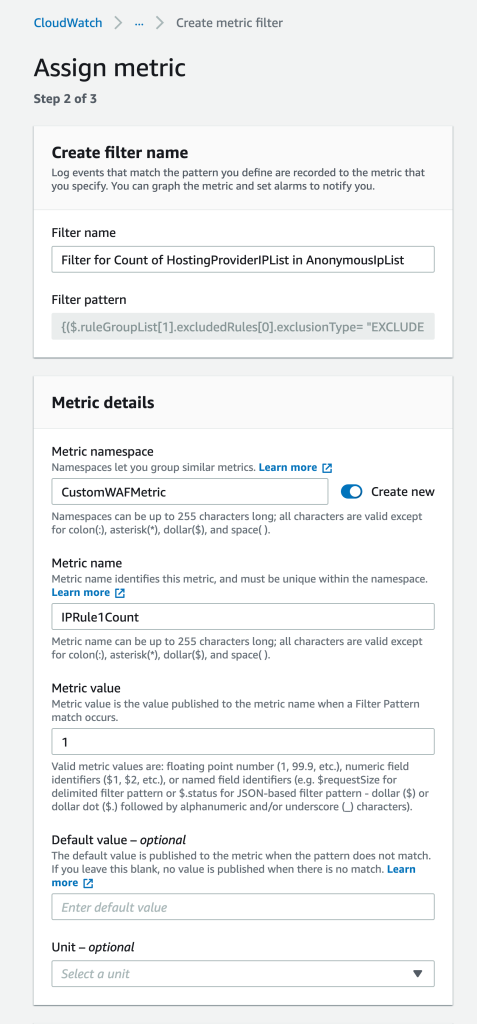
Figure 5: Create Metric filter in CloudWatch console to look at counts in a rule
After you create your metric filter, you can create an Amazon CloudWatch Alarm by following these steps here. You can look for the namespace and metric name of the metric filter that you created and set a threshold on which you would want to be notified. For example, you can create an alarm that will send an Amazon Simple Notification Service (Amazon SNS) notification to an SNS topic, where in this example we have set it if the metric count is greater than 25. Once the number of requests breaches the threshold, the alarm goes into the “Alarm” state and an event is sent to the SNS topic for alerting.
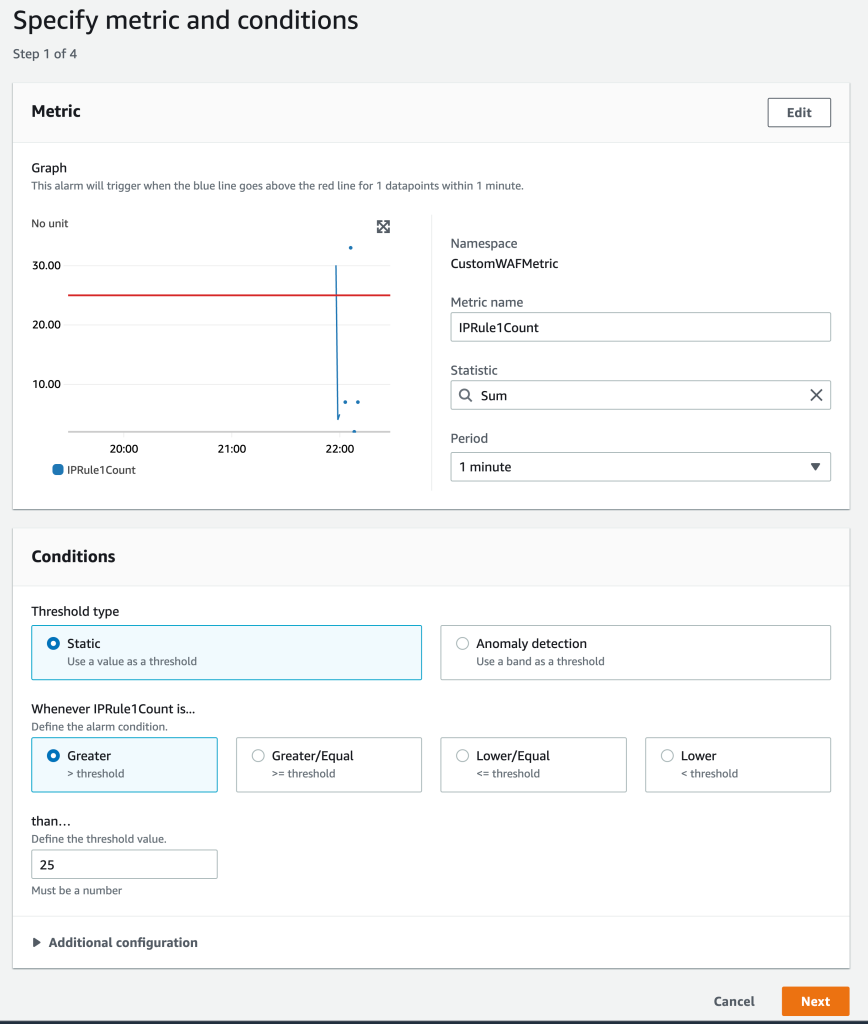
Figure 6: Create Alarm in CloudWatch console to notify once it breaches the configured threshold.
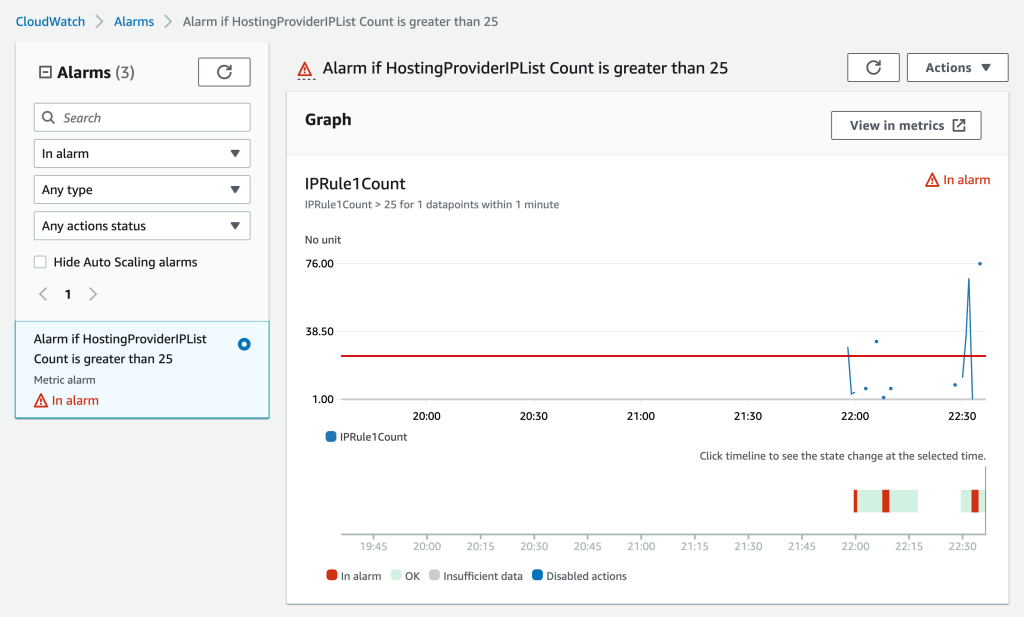
Figure 7: Viewing the CloudWatch Alarm in the CloudWatch Console to determine if data points are breaching the configured alarm static threshold.
Contributor insights
Contributor insights provide a cost-efficient way to get the top N contributors to a dashboard. You can use it to analyze time-series data to help understand who or what is impacting Web Applications, pinpoint outliers, and rank the top talkers based on different fields in the logs, such as IP address, User-Agent, host, and terminating rules. You can create Contributor Insights rules using one or more contributors and add filters to apply to only a subset of requests. For example, you can check the top IP addresses of only the blocked requests. In this section, we provide a few examples on creating Contributor Insights Rules.
Example: Get the top ten IP addresses, URI combination for all of the Blocked requests
In this example, we’ll get the top 10 contributors based on IP and URI for all of the blocked requests.
As shown in the following log entry, we must monitor httpRequest.clientIp and httpRequest.uri for requests where action = “BLOCK”. Here are the steps to create the rule:
- In the CloudWatch console, choose Contributor Insights, and then choose Create rule.
- In the Create rule wizard, choose Custom rule.
- Under Log group(s), select the name of the WAF log group that you created earlier (eg: aws-waf-logs-xxxx).
- For Log format, choose JSON.
- Under Contribution→ keys, enter a contributor type httpRequest.clientIp and httpRequest.uri.
- Under Contributions → Filters use the following.
- Match → Action
- Condition → In
- Value → BLOCK
- For Aggregation → Aggregate on, choose COUNT.
- Then, select Next.
- For Rule name, enter a name.
- For Rule State, select Next.
- Review changes, and select Create rule.
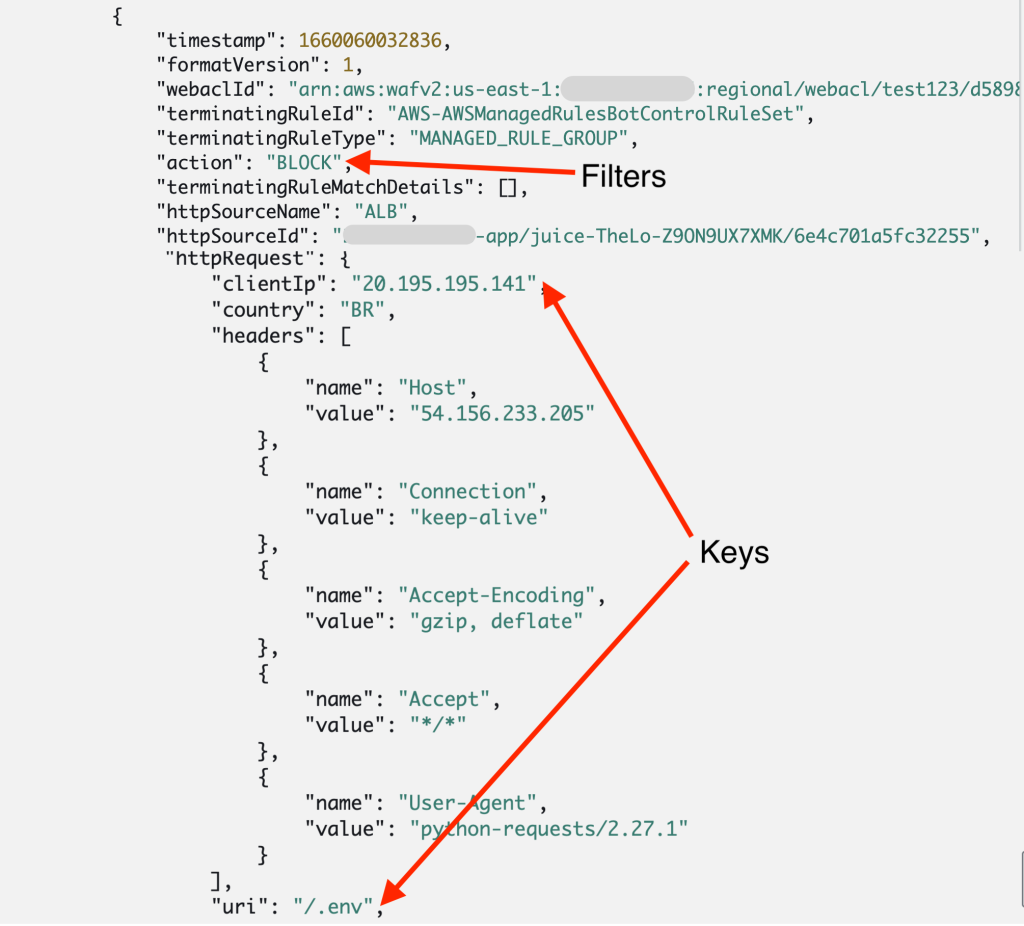
Figure 8: Sample WAF log entry with the components for viewing URI and IP address for all Blocked requests for Contributor Insights.
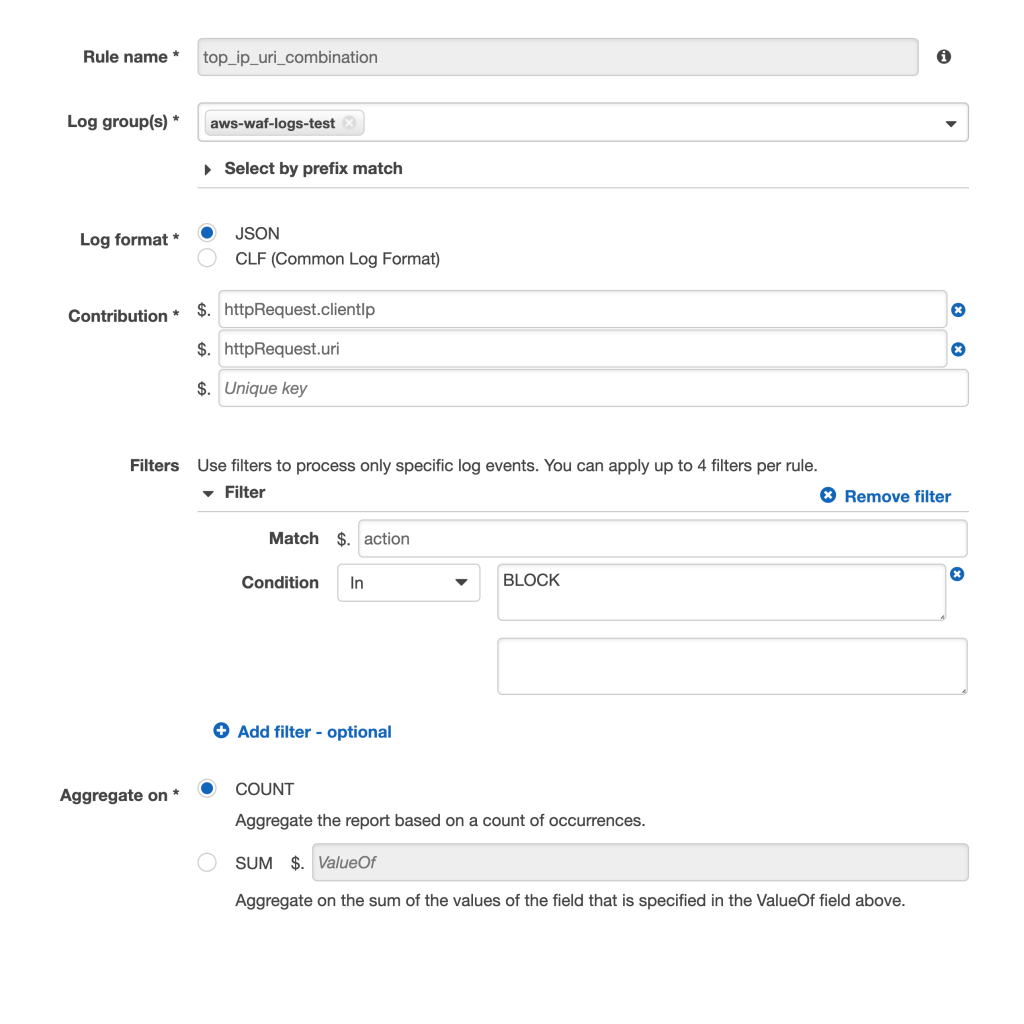
Figure 9: Contributor Insights rule for viewing URI and IP address for all Blocked requests for Contributor Insights.
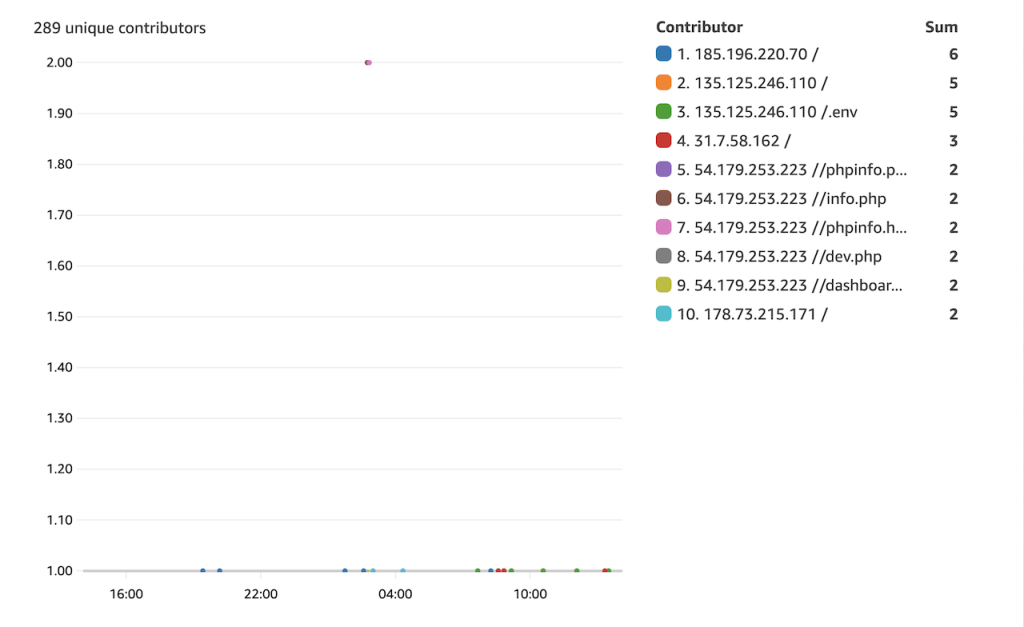
Figure 10: Contributor Insights results for viewing URI and IP address for all Blocked requests for Contributor Insights
In the Contributor Insights console, if you select the Syntax tab, then you’ll see the rule body in the JSON format.
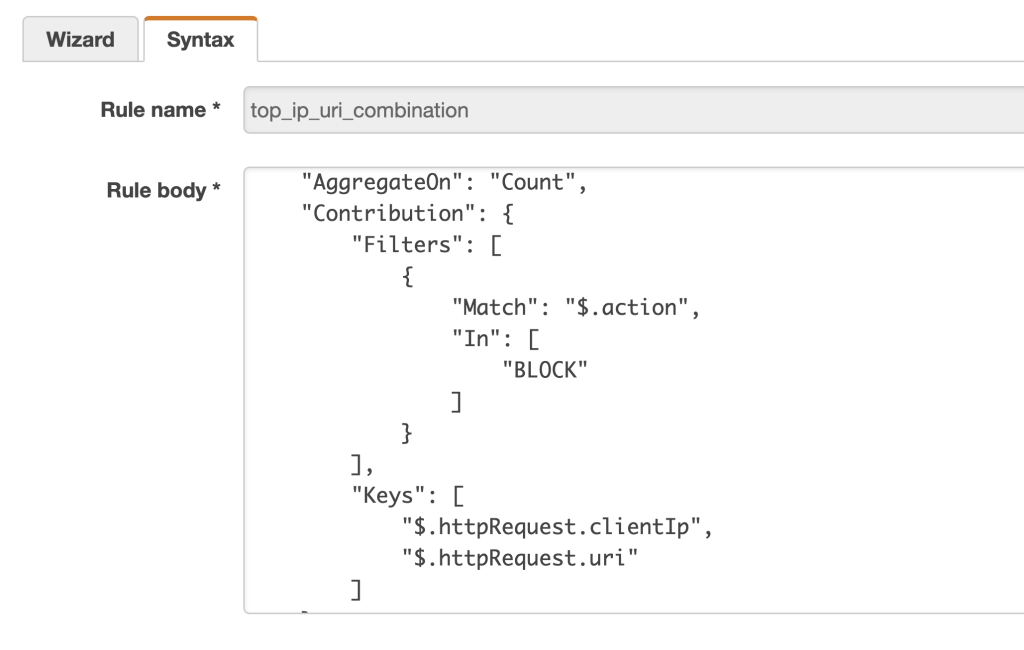
Figure 11: Rule template in JSON format.
The following table lists a few example contributor insights rules that can be useful for WAF log Analysis. The following table provides JSON templates that you can copy and paste in the syntax tab to create the rules.
| Use case | Link to the JSON template |
| Get the Top ten Terminating Rule ids | link |
| Top 100 IP addresses blocked by rate-based rules | link |
| Get the top ten IP addresses, URI combination for all the Blocked requests (example given above) | link |
| Get the top ten rules within the Rule group that Blocked or Counted | link |
After you create the Contributor Insights Rules, you can combine them to a dashboard to easily view and analyze the top talkers. You can use the CloudFormation template here to deploy the Contributor Insight rules.
Conclusion
In this post, we demonstrated how to use CloudWatch Log Insights to identify security incidences and false positives by interactively searching and analyzing WAF logs. In addition, we revealed how to leverage Contributor Insights to create dashboards for top N-contributors providing an easy platform to perform ongoing analysis for your WAF and metric filters to find specific patterns in WAF logs. We walked you through how to set up WAF logging with CloudWatch Logs with a CloudFormation template to help you get started and we showed how to use different CloudWatch features, such as Logs Insights, Contributor Insights, and metric filters to easily analyze data in different ways through the provided examples. Along with that, we showed you how to set up monitoring and alerting to different useful metrics.
About the authors: