AWS Machine Learning Blog
Visualizing Amazon SageMaker machine learning predictions with Amazon QuickSight
AWS is excited to announce the general availability of Amazon SageMaker integration in QuickSight. You can now integrate your own Amazon SageMaker ML models with QuickSight to analyze the augmented data and use it directly in your business intelligence dashboards. As a business analyst, data engineer, or data scientist, you can perform ML inference in QuickSight with just a few clicks. This process makes predictions on new data and uses Amazon SageMaker models for different use cases, such as predicting the likelihood of customer churn, scoring leads to prioritize sales activity, and assessing credit risk for loan applications.
Customer use case
Change Healthcare is a leading independent healthcare technology company that provides data and analytics-driven solutions to improve clinical, financial, and patient engagement outcomes in the US healthcare system.
At Change Healthcare “We are leveraging Amazon SageMaker for various machine learning use cases such as reducing overpayment and claim waste.” says Jayant Thomas, Senior Director of AI Engineering. “We’re pleased to see the addition of SageMaker integration in Amazon QuickSight. This strengthens QuickSight as one of the leading solutions for BI, ML insights and dashboard publishing, as it streamlines the workflow and the development cycle in SageMaker-based inferencing architectures.”
Integration of Amazon QuickSight with Amazon Sagemaker
Traditionally, getting the predictions from trained models into a BI tool requires substantial heavy lifting. You have to write code to ETL the data into Amazon Simple Storage Service (Amazon S3), call the inference API to get the predictions, ETL the model output from Amazon S3 to a queryable source, orchestrate this process whenever new data is available, and repeat the workflow for every model. Inference endpoints enable easier consumption of the models, but come at the cost of potentially incurring charges when not in use. Finally, you use third-party tools like Excel to perform analysis and report on the predictions, which makes it difficult to update and share the results to a large number of users. The end-to-end process to get value from the model is undifferentiated and can take days or weeks before the predictions of the models get to the business decision-makers.
The QuickSight integration with Amazon SageMaker feature addresses these pain points by automating the entire data movement and inference pipeline.
To run inferencing on your dataset, you can connect to any of the QuickSight supported data sources (such as Amazon S3, Amazon Athena, Amazon Aurora, Amazon Relational Database Service (Amazon RDS), and Amazon Redshift, and third-party application sources like Salesforce, ServiceNow, and JIRA), select the pretrained Amazon SageMaker model you want to use for prediction, and QuickSight takes care of the rest. After the data ingestion and inference job are complete, you can create visualizations and build reports based on the predictions and share it with business stakeholders, all in an end-to-end workflow. The output of the inference is stored as a QuickSight SPICE dataset and makes it possible to share it with others. You can perform manual, one-off predictions, run predictions on a schedule, or trigger predictions programmatically via the QuickSight dataset APIs when your data refreshes.
This post walks you through a use case of customer churn, in which you predict the likelihood of customers leaving their mobile phone operator. As the provider, if you find out which customer is leaving, you can offer timely incentives to stay, such as a phone upgrade or perhaps having a new feature activated. Incentives are often much more cost-effective than losing and reacquiring a customer. You can use customer interaction and service usage data to build a model that can find those customers most likely to churn.
For this use case, you train an Amazon SageMaker model to predict customer churn, connect your QuickSight to Amazon SageMaker, use the model on your current customer base to identify at-risk customers, and provide predictive dashboards through QuickSight. You don’t need any specialized ML experience to set this up. The walkthrough demonstrates how to build this dashboard with predicted data.
Setting up your Amazon SageMaker environment
To set up your Amazon SageMaker environment, complete the following steps:
- On the Amazon SageMaker console, choose Notebook instances.
- Choose Create notebook.
- For Notebook instance name, enter a name for your instance; for example, QS-sagemaker.
- For Notebook instance type, choose ml.t3.medium.
- For Choose an IAM role, choose Create a new role.
- For S3 bucket, choose Any S3 bucket.
Normally, you should select a specific bucket, but you haven’t created one yet; you do so in the notebook.
- Choose Create role.
- Choose the Git repositories
- For Repository, choose Clone a public Git repository to this notebook instance only.
- For Git repository URL, enter
https://github.com/aws-samples/quicksight-sagemaker-integration-blog.git. - Leave all other fields at their defaults.
- Choose Create notebook instance.
You can now see your list of notebook instances. Wait for your new instance status to show as In Service, which can take up to 5 minutes. You may have to refresh the page, depending on your browser.
- Next to your instance, choose Open JupyterLab.
The JupyterLab page opens in your browser.
Running the notebook
To run your notebook, complete the following steps:
- On the JupyterLab page, open the quicksight-sagemaker-integration, and choose customer_churn.ipynb.The IPython notebook opens.
- In the first cell of the notebook, set the name of your S3 bucket. You need to create an S3 bucket to store your datasets and the model you build, see How do I create an S3 Bucket? This should be within the same region as the Notebook Instance.

- Read and run all the cells in the notebook.
The notebook includes preprocessing, training the model, and postprocessing steps. It creates the model for you with the name that starts with QS-inference-pipeline-. This is the name of the Amazon SageMaker model that you want to use to perform the inference and augment the dataset in the QuickSight.
Setting up Amazon QuickSight to work with Amazon SageMaker
QuickSight’s integration with Amazon Sagemaker is only available on the Enterprise Edition of Amazon QuickSight. If you’re using the Standard Edition, you can easily upgrade your subscription. For more information about the different editions, see Amazon QuickSight Pricing.
- You need the QuickSight Enterprise Edition to complete the following steps. For more information, see How do I create an Amazon QuickSight Enterprise edition account?
- After you log in to QuickSight, select the same Region that you launched Amazon SageMaker.
- Choose Manage QuickSight.

- Choose Security & permissions.
- Choose Add or remove.

- Select Amazon S3.
- Choose Select S3 buckets.

- Select the bucket you created.

- Select Amazon SageMaker.
- Choose Update.
 Completing these steps requires administrator privileges.
 - To return to the QuickSight console, choose the QuickSight
Setting up the dataset in QuickSight and pulling in the churn prediction
A test dataset already uploaded into your bucket when you ran the notebook. It should be in S3://<bucket_name>/<prefix>/rawtest/test.csv. This file has customer details in the same format as the training dataset you used earlier in Amazon SageMaker, with the exception of the label column (Churn). You use this test set for prediction. You can get the <bucket_name> and <prefix> from the first cell of the notebook.
- On the QuickSight console, choose Manage Data.
- Choose New Dataset.
- Choose S3.

- Using a text editor, create a manifest file (e.g.
manifest.json) on local with the following content (replace<bucket_name>and<prefix>with what you have set before in the notebook): - Upload this file to create the Amazon S3 data source.

- Choose Edit/Preview data.

- To augment your data with the Amazon SageMaker model you built earlier, choose Augment with SageMaker.

- For Model, choose the notebook you created (with the custom name that starts with
QS-inference-pipeline-).Before you use an Amazon SageMaker model with QuickSight data, you have to create a JSON schema file that contains the metadata that QuickSight needs to process the model. It provides metadata about the fields, data types, column order, output, and settings that the model expects, such as type of the instance to use for generating the predictions. - Download the schema file for this post from the GitHub repo.
- Save the file
Churn_schema.jsonto local. - For Schema, upload your file.

- Choose Next.You’re now on the Review inputs page, which shows how each field in the provided schema is mapped to your dataset’s fields. These fields are what you model expects as inputs for inference. If any fields aren’t mapped correctly, change them from the drop-down menus.
- Choose Next.

You’re now on Review outputs page, which shows you the output of your model and the field name to add to your dataset as the output of the prediction. You can change the field name to a proper name that you want to show in your dataset. - Choose Prepare data.

- Read and close the info message.
- Choose Save & Visualize.

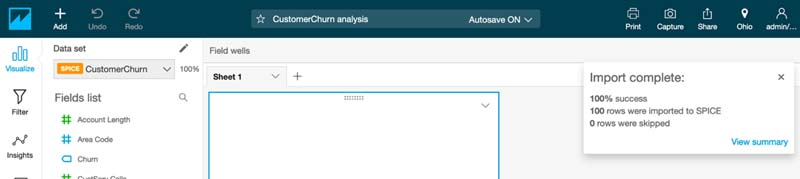
This starts a job in SageMaker to run the inference and adds a new column to your dataset. It can take approximately 4 minutes for the Amazon SageMaker model to run a batch transform job to complete the inference and load the full scored dataset with the Churn column into SPICE.
SPICE is the in-memory optimized calculation engine for QuickSight, designed specifically for fast, one-time data visualization. SPICE is engineered to rapidly perform advanced calculations and serve data. You can save time with SPICE because you don’t need to retrieve the data every time you change an analysis or update a visual.
When the Amazon SageMaker inference is complete, you see an Import complete message.
Creating a dashboard with churn predictions
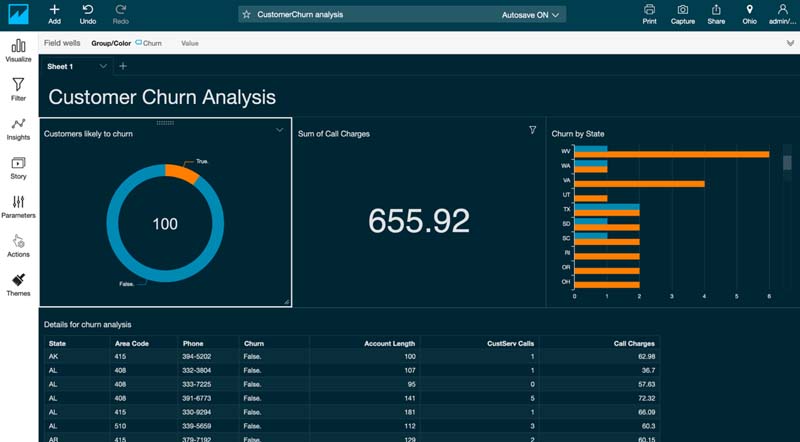
You can now use the prediction output to build a dashboard and visualize the results. The following screenshot shows the final dashboard you achieve with this walkthrough.

Plotting customers likely to churn
Start by building a donut chart to plot customers likely churn.
- Under Fields list, choose Churn.
Because the Visual types uses Auto Graph by default, QuickSight determines that a bar chart is best suited to represent this data and gives you the split between true and false predictions.

- To see this as a donut chart, under Visual types, choose the donut icon.
- To change the title, choose the title field and enter
Customers likely to churn.

- To hide the legend, choose the Visual drop-down menu and choose Hide legend.

Visualizing potential revenue loss due to churn
You now add another visual showing how much revenue you stand to lose from customer churn.
- Choose Fields list and enter
charge.
 You see that charges are spread over four different columns.
 You can create a calculated field that adds up these four columns.
 - Choose Add.
- Choose Add calculated field.

- For Calculated field name, enter
Call Charges. - For Formula, choose the following fields:
- Day Charge
- Eve Charge
- Intl Charge
- Night Charge
- Choose Create.

- Choose Add.
- Choose Add visual.

- Under Fields list, choose Call Charges.You can now see the total call charges across all customers.

You can also filter to show only charges for customers that are likely to churn. - Choose Filter.
- Choose Create one.
- Choose Churn.

- Choose the filter to expand it.

- Select True.
- Choose Apply.

You can now see charges that you stand to lose due to customer churn. - Choose the visual title and enter the name
Predicted loss of charges.

Visualizing churn by state
You can also visualize the number of churns by state.
- Choose Add.
- Choose Add visual.
- Under Fields list, choose State and Churn.
- Under Visual types, choose the horizontal stacked bar.
- Hide the legend.
- Change the title to
Churn by State.

Details for churn analysis
This final visual combines many details for churn analysis.
- Choose Add.
- Choose Add visual.
- Under Fields list, choose State, Area code, Phone, Account Length, CustServ Calls, Call Charges, and Churn.
- Under Visual types, choose the table icon.
- Change the name to
Details for churn analysis.

Customizing the dashboard display
The following section shows how to improve the look of your dashboard. You can first add a title.
- Choose Add.
- Choose Add title.

- Choose Sheet title and enter
Customer Churn Analysis.

Next, resize the visuals to make three of them fit on the top row. - To resize, choose the bottom right corner handle.
- To move the visual around, choose the top center handle.

- To change the theme, choose Themes.
- Choose Starter themes.
- Choose Midnight.
- Choose Apply.

You have completed the design process and are ready to publish the dashboard.
Publishing the dashboard
To publish your dashboard, complete the following steps:
- Choose Share.
- Choose Publish dashboard.

- For Publish new dashboard as, enter a name for your dashboard.
- Choose Publish dashboard.

You now have the dashboard you set out to build.

Conclusion
QuickSight and Amazon SageMaker make it faster, easier, and more cost-effective for you to use your ML models for visualization and predictions. This post demonstrated how to integrate QuickSight with Amazon Sagemaker to automate the entire data movement and inference pipeline, without having to write a single line of code. This solution reduces the time it takes to get predictions from your company’s pre-built models. In addition, the approach is very cost-effective because you only pay for the hourly instance usage of the SageMaker batch transform job when the inference is running, without requiring SageMaker endpoints to run even when not in use.
Give the model inference feature of QuickSight a try, and share your feedback and questions in the comments.
About the Authors
 Saeed Aghabozorgi Ph.D. is senior ML Specialist in AWS, with a track record of developing enterprise level solutions that substantially increase customers’ ability to turn their data into actionable knowledge. He is also a researcher in the artificial intelligence and machine learning field.
 Raj Patel is a Software Development Manager at AWS QuickSight. He leads the Machine Learning (ML) Insights team, building features that use ML to solve business problems. Outside work, he enjoys hiking, watching sports and spending time with his 2 kids.
 Luis Wang is a principal product manager for Amazon QuickSight. He’s been with AWS for over 6 years, working on various services including Amazon EC2 and then launching Amazon QuickSight. Luis is now focused on the application of machine learning and AI to business intelligence and analytics at QuickSight. He enjoys running, watching sitcoms and spending time with his family.
 Arun Santhosh is a Specialized Global Solution Architect for Amazon QuickSight.